


The best data analysis tools in 2026 span five categories: query and extraction (SQL, BigQuery), scripting and statistical analysis (Python, R), visualization and BI (Tableau, Power BI, Looker), modern data stack infrastructure (dbt, Snowflake, Spark), and AI-assisted analysis (ChatGPT Code Interpreter, GitHub Copilot). No analyst needs every tool on this list. Every analyst needs to know which tools map to which problems — and which ones hiring managers actually check for.
Data analysis tools are software applications and programming environments used to collect, clean, transform, and visualize data to extract business insights. The right choice depends on data volume, team structure, analysis type, and business context — not on which tool happens to be trending on LinkedIn this month.
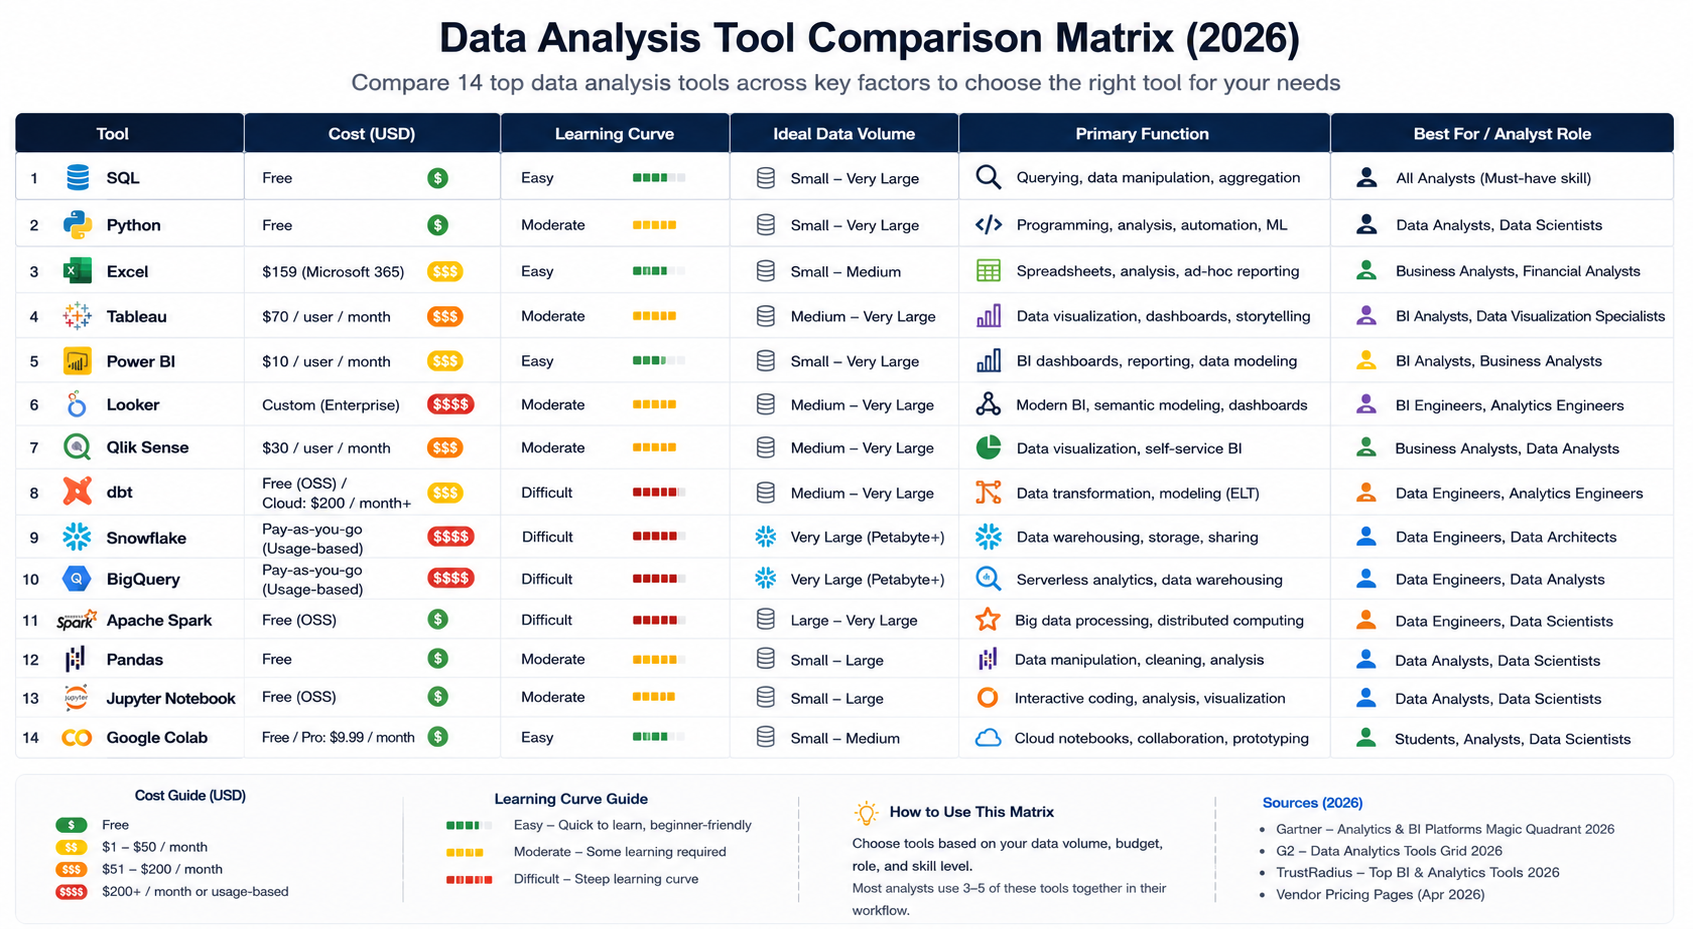
This guide covers the 14 tools that appear most consistently in data analyst job descriptions, technical interviews, and live production workflows in 2026. Each tool gets a clear breakdown: what it is, what it does well, where it falls short, and when to reach for it.
Why Your Tool Stack Shapes Your Career Ceiling?
A data analyst who only knows Excel can handle reporting. Add SQL, and you can answer questions no pre-built dashboard was designed for. Add Python, and you can automate, model, and scale analysis to any data volume. Add a BI tool, and you can communicate findings to stakeholders who will never open a terminal.
The progression is real, and so is the pay gap.
Analysts proficient in Python and SQL command 35–50% higher salaries than those limited to spreadsheet tools, according to hiring benchmarks aggregated across Naukri, LinkedIn, and Glassdoor India postings for 2024–2025. For context on the full earnings curve, see data analytics salary in India.
The tool stack is not a minor line on your resume. It is the resume.
The good news: you do not need to learn everything at once. The tools in this list build on each other. SQL first. Python second. A BI tool third. Everything beyond that is deliberate specialization based on where you want to work and what problems you want to solve.
📊 Quick Stat: According to the LinkedIn Jobs on the Rise 2024 India report, data analytics roles grew 41% year-on-year. SQL and Python appeared in over 78% of those job postings.
SQL: The Non-Negotiable Foundation of Data Analysis?
SQL (Structured Query Language) is the standard language for querying relational databases — and the single data analysis tool that no working analyst can skip, regardless of industry, company size, or seniority level.
What is SQL? SQL is a declarative programming language used to retrieve, filter, aggregate, and transform data stored in relational databases and cloud data warehouses. Every major data platform — PostgreSQL, MySQL, BigQuery, Snowflake, Redshift, SQL Server — uses SQL as its primary query interface.
Strengths
- Universal — the same syntax works across every major database and warehouse
- Readable — close to plain English, which makes code reviews and handoffs practical
- Battle-tested — enormous community, deep documentation, and abundant learning resources
- Scales — what you learn on PostgreSQL works on BigQuery at petabyte scale
Limitations
- Not designed for unstructured data (text, images, audio, video)
- Does not natively support machine learning or predictive modeling
- Performance depends heavily on how well queries are written and how underlying data is indexed
When to Use SQL?
Any time your data lives in a structured database or data warehouse — which covers roughly 90% of analyst workflows. In 2026, SQL is not a beginner skill you graduate out of. Senior analysts write complex window functions and CTEs daily. Data engineers build dbt transformation models in SQL. Business analysts run ad hoc queries against cloud warehouses in SQL.
The tool has been around since the 1970s because it is exceptionally good at one job: telling a structured database to give you exactly the rows and columns you need.
💡 Takeaway: SQL is the first tool to learn, period. PostgreSQL and SQLite are free to install. BigQuery and Snowflake offer free tiers generous enough to build a real portfolio on.
Python: The Analyst's Swiss Army Knife
Python is the dominant scripting language for data analysis, data science, and analytics engineering. It displaced R as the top data language around 2019 and has extended its lead every year since.
What is Python for data analysis? Python for data analysis refers to using the Python programming language — primarily with the pandas, NumPy, Matplotlib, and Seaborn libraries — to clean, transform, explore, model, and visualize datasets. It is used by analysts at companies from early-stage startups to Google, Amazon, and Flipkart.
According to the Stack Overflow Developer Survey 2024, Python is the most-used programming language overall for the fourth consecutive year. In data-specific roles, its penetration is even higher.
The Core Python Libraries Every Analyst Needs
pandas handles data manipulation. Filtering rows, grouping, merging tables, reshaping data, handling missing values — if you can do it in Excel, you can do it in pandas on 10 million rows in seconds.
NumPy provides the numerical foundation: arrays, matrix operations, statistical functions. Most other scientific Python libraries are built on top of it.
Matplotlib and Seaborn handle visualization. Charts are reproducible and version-controllable — not dependent on manually clicking through a GUI every time the underlying data changes.
A Real-World Python Workflow
A product analyst at an e-commerce company might run this sequence in a single Python notebook: pull a CSV export from Redshift → clean missing order values with pandas → calculate day-over-day revenue with NumPy → plot a 30-day trend line with Matplotlib → export the summary table to Google Sheets for the team meeting. That workflow takes 40–60 lines of code and runs identically every time. For data management and analysis at any serious scale, that reproducibility is why Python wins.
Strengths
- Enormous library ecosystem (pandas, scikit-learn, TensorFlow, Plotly, Streamlit, and hundreds more)
- Smooth upgrade path into machine learning without switching tools
- Version-controllable and automatable — run the same analysis on fresh data at any time
- Completely free and cross-platform
Limitations
- Higher initial learning curve than Excel or no-code BI tools
- Memory-bound for truly massive datasets — Spark or BigQuery is the right tool above ~100GB
- Slower execution than compiled languages, which is acceptable for analysis but not for real-time systems
When to Use Python?
Large or messy datasets, reproducible pipelines, any workflow where automation saves meaningful time, and any analysis that might eventually require machine learning tools.
💡 Takeaway: Python is the second tool to learn. Google Colab gives you a free cloud Jupyter environment in the browser — no local setup required to start.
R: The Statistician's Tool That Still Has a Place
R is a programming language designed specifically for statistical computing and data visualization. It predates Python's data ecosystem by roughly a decade and still dominates in specific fields.
What is R used for in data analysis? R is used for statistical analysis, data visualization, and academic research. It is most prevalent in pharma, clinical trials, economics, and academic data science — where its deep statistical library and publication-quality graphics (via ggplot2) have decades of institutional adoption behind them.
Strengths
- Statistical modeling depth unmatched by Python in pure statistics and research workflows
- ggplot2 produces publication-quality visuals with a cleaner grammar-of-graphics syntax than Matplotlib
- tidyverse (dplyr, tidyr, purrr) provides an elegant, consistent approach to data wrangling
- RMarkdown generates reproducible research documents in one step
Limitations
- Steeper learning curve than Python for general-purpose data tasks
- Smaller job market demand in industry roles compared to Python
- Less natural path into production machine learning or engineering pipelines
When to Use R
Academic research, clinical data analysis, econometrics, statistical consulting, or any organization where R is already the institutional standard. For everyone entering the industry job market: Python first, R only if your target employer specifically requires it.
Python vs R: Which Should You Learn First?
This is one of the most-asked questions in data careers. The honest answer depends on where you want to work.
Bottom line: If you are targeting industry roles — tech companies, startups, consulting, e-commerce, fintech — learn Python. If you are heading into academia, clinical research, or economics, R is the right foundation. Most senior analysts eventually have exposure to both; the question is which to build first.
Excel and Google Sheets: Still the Most-Used Analysis Tools Globally
Excel has been declared dead or obsolete roughly every five years for the past two decades. It is still the most-used data analysis tool on the planet.
What is Excel used for in data analysis? Microsoft Excel is used for small-to-medium dataset analysis (under ~500,000 rows), financial modeling, one-off reporting, and stakeholder-facing summaries. Its PivotTables, Power Query, and Power Pivot features make it capable of serious analytical work on datasets that fit within its row limits.
Strengths
- Universal — every business user already has it and knows it
- PivotTables are one of the fastest ways to summarize structured data for non-technical audiences
- Power Query handles data transformation with a code-optional interface
- The standard tool in investment banking and FP&A financial modeling
Limitations
- Not designed for multi-million-row datasets — performance degrades quickly at scale
- Not reproducible — manual steps, no version control, easy to introduce silent errors
- No native machine learning or statistical modeling beyond basic regression
When to Use Excel
Financial modeling, one-off reports for non-technical stakeholders, small-dataset exploration, and any context where the practical constraint is sharing a file with someone who does not have Python or a BI tool.
Google Sheets adds real-time collaboration and direct integration with Google Analytics 4, BigQuery, and Looker Studio — which makes it a legitimate part of modern data stacks, not legacy tooling.
💡 Takeaway: Know Excel well. It is the shared language between analysts and business stakeholders. Power Query alone is worth learning for anyone who works with irregular or multi-source data regularly.
Tableau: The Gold Standard for Business Visualization
Tableau is a data visualization and business intelligence platform used to build interactive dashboards and reports for business stakeholders.
What is Tableau? Tableau is a BI and visualization platform that connects to databases, spreadsheets, cloud warehouses, and APIs, then enables analysts to build interactive dashboards without writing code. It is known for its visual design quality and the ability for non-technical stakeholders to explore published dashboards independently. Salesforce acquired Tableau in 2019, deepening its CRM integration significantly.
According to Gartner's Magic Quadrant for Analytics and Business Intelligence Platforms 2024, Tableau has held a Leaders position for over a decade.
Strengths
- Best-in-class visual output — dashboards look polished with minimal design effort
- Drag-and-drop interface has a low entry floor and a high analytical ceiling
- LOD (Level of Detail) expressions enable powerful analytical logic without SQL
- Large community, Tableau Public for free portfolio building, extensive training resources
Limitations
- Expensive — enterprise licensing is a real barrier for startups and SMEs
- LOD expressions and parameter-driven logic take time to master properly
- Performance can degrade on large, unoptimized data sources connected live
When to Use Tableau
Organizations with a Tableau license, especially those using Salesforce CRM. Analysts who need the strongest visual output for executive dashboards. Anyone building dashboards that non-technical stakeholders need to self-explore.
Power BI: Microsoft's Dominant BI Platform
Power BI is Microsoft's business intelligence and reporting platform — and the most widely deployed BI tool globally by user count.
What is Power BI? Power BI is a cloud-based BI platform that connects to Microsoft and third-party data sources to create interactive reports and dashboards. It is deeply integrated with the Microsoft 365 ecosystem — Excel, Azure, SharePoint, and Teams — making it the default BI tool for organizations already on Microsoft infrastructure.
Strengths
- Significantly more affordable than Tableau for Microsoft-infrastructure organizations
- Power Query (shared with Excel) provides a familiar, code-optional transformation layer
- Native integration with Azure, Teams, SharePoint, and SQL Server
- DAX language is powerful once learned, enabling complex calculated measures
Limitations
- DAX has a steep learning curve — not intuitive for analysts coming from SQL or Excel formulas
- Visual output is less polished than Tableau out of the box
- Performance issues on large semantic models if not properly optimized
When to Use Power BI
Organizations on Microsoft 365, Azure, or with existing SQL Server infrastructure. Analysts targeting corporate, BFSI, manufacturing, and enterprise tech roles, where Power BI has the highest adoption. For a deeper dive on BI selection, see data visualization and business intelligence.
Tableau vs Power BI: Which BI Tool Should You Learn?
Both are strong. The right choice depends more on where you want to work than on the tools themselves.
Bottom line: In the Indian job market, Power BI appears in more mid-market and enterprise job descriptions. Tableau is more prevalent in top-tier analytics roles, MNC analytics centers, and product analytics. Check three to five job descriptions at your target companies — they will tell you which one to prioritize.
Looker and Looker Studio: The Google Analytics Stack
Looker is a data platform (now part of Google Cloud) built around a semantic modeling layer called LookML. Rather than building dashboards by pulling data in, teams define metrics centrally in LookML, ensuring every dashboard in the company uses consistent definitions.
What is Looker? Looker is a business intelligence and data exploration platform that uses a proprietary semantic layer (LookML) to define business metrics once, serving consistent numbers across all dashboards and reports. Google acquired Looker in 2020. Its free lightweight companion, Looker Studio (formerly Google Data Studio), integrates natively with GA4, Google Ads, Search Console, and BigQuery.
When to Use Looker
Organizations on Google Cloud with multiple teams that need consistent metric definitions — revenue, active users, churn — defined in one place. Marketing and growth analysts working in the Google ecosystem will find Looker Studio the fastest path to zero-cost GA4 and Ads dashboards.
💡 Takeaway: If your company uses GA4 or Google Cloud, Looker Studio is the fastest free BI tool to learn. Full Looker is powerful but assumes a data team maintaining the LookML layer underneath — it is not a beginner-first tool.
dbt: The Data Transformation Tool Reshaping the Modern Stack
dbt (data build tool) is a SQL-based transformation framework that brings software engineering best practices — version control, testing, modular code, documentation — to analytics workflows running inside cloud data warehouses.
What is dbt? dbt is an open-source data transformation tool that lets analysts and analytics engineers write modular SQL SELECT statements (called "models"), then run, test, and document them like production software code. It runs inside your existing data warehouse (Snowflake, BigQuery, Redshift, or Databricks) — it does not move or store data itself.
According to the dbt Labs State of Analytics Engineering Report 2024, over 35,000 organizations use dbt in production — up from roughly 9,000 in 2021.
Why dbt Matters for Analysts
Before dbt, data teams maintained scattered SQL scripts with no tests and no documentation. With dbt, those transformations become modular models in a Git repository, with automated tests that flag broken data before it reaches dashboards. Business analysts who learn dbt move from being consumers of transformation logic to being able to build and own it.
Strengths
- SQL-first — no new language required, just better-organized SQL
- Version control via Git — every change is tracked, reversible, and reviewable
- Automated testing — assert that order totals are never negative, user IDs always join cleanly
- Self-documenting — data lineage and column descriptions are part of the framework itself
Limitations
- Requires a cloud data warehouse to run against — not a standalone tool
- Adds overhead for solo analysts where speed matters more than structure
- Learning curve on dbt project structure, macros, and packages
When to Use dbt
Tech companies, analytics engineering roles, any team that needs reliable, reproducible transformations at scale. If a job description mentions "modern data stack," dbt is almost certainly expected.
Snowflake and BigQuery: Cloud Data Warehouses Analysts Live In
Most enterprise analytics in 2026 runs against a cloud data warehouse. Snowflake and Google BigQuery are the two dominant platforms — and the distinction between them matters for which companies you target.
What is a cloud data warehouse? A cloud data warehouse is a fully managed, scalable data storage and query environment hosted in the cloud. It stores structured and semi-structured data and supports SQL queries across terabyte-to-petabyte scale datasets without the overhead of managing physical hardware.
The key analyst skill here is writing efficient SQL. A SELECT * on a 500GB BigQuery table can cost real money. Analysts who understand query optimization, partitioning, and clustering make better architectural decisions and are meaningfully more valuable to data teams than those who treat warehouses as unlimited resources.
Apache Spark: When Data Outgrows Everything Else
Apache Spark is an open-source distributed computing engine that processes massive datasets in parallel across a cluster of machines.
What is Apache Spark? Apache Spark is a distributed data processing framework that partitions large datasets and processes them in parallel across multiple nodes. It supports Python (PySpark), SQL, Scala, and Java. It is the foundation of most big data pipelines in e-commerce, fintech, telecom, and any domain processing billions of daily events.
When Analysts Actually Need Spark
Most analysts will not run PySpark jobs daily. But when you are working with clickstream data, IoT telemetry, transaction logs, or user-event pipelines at hundreds of millions of rows, Spark is what makes those workloads feasible at reasonable cost.
Even analysts who do not write Spark directly benefit from understanding it — it explains why certain pipelines are structured the way they are, and why certain warehouse queries behave differently on partitioned data.
💡 Takeaway: Learn Spark after mastering SQL and Python, when targeting data engineering or senior analytics roles. PySpark knowledge adds real leverage in large consumer-tech, fintech, and logistics companies.
AI-Assisted Analysis: What Actually Works in 2026
AI-assisted analysis is not a single tool. It is a category that materialized practically overnight and is now embedded in daily analyst workflows across skill levels.
What is AI-assisted data analysis? AI-assisted data analysis refers to using large language models (LLMs) and AI coding tools to accelerate querying, code generation, statistical interpretation, and documentation. Tools include GitHub Copilot, ChatGPT Code Interpreter, and Claude for code generation and analytical reasoning support.
What Actually Helps Analysts in 2026
GitHub Copilot writes and completes Python and SQL code inside your IDE. Analysts using Copilot report meaningful time savings on repetitive data manipulation — not because Copilot is always right, but because correcting a 90%-correct suggestion is faster than writing from scratch.
ChatGPT and Claude are used for explaining unfamiliar datasets, generating first-pass analysis code, interpreting statistical outputs, debugging pandas errors, and writing documentation. Most analysts use them daily for tasks that previously required Stack Overflow searches and 20 minutes of context-switching.
What AI Tools Do Not Replace
AI tools accelerate analysts who already know the foundations. They do not replace those foundations.
An analyst who cannot read a pandas DataFrame output does not know whether Copilot's code is correct. One who does not understand SQL joins cannot evaluate whether a generated query handles NULLs properly. The analysts seeing the biggest productivity gains from AI tools in 2026 are the ones who already had strong technical skills going in.
Best Data Analysis Tools by Role and Use Case
Different analyst roles rely on different core tool combinations. This table maps common analyst archetypes to the stack employers actually expect — based on aggregated job description data from Naukri, LinkedIn India, and Indeed for 2024–2025.
Analyst RoleMust-Know ToolsSecondary / Advanced ToolsBusiness AnalystSQL, Excel, Power BI or TableauPython (pandas), Looker StudioData Analyst (tech/startup)SQL, Python, dbt, Looker or TableauSnowflake/BigQuery, GitMarketing AnalystGoogle Sheets, Looker Studio, SQLPython, GA4, AmplitudeFinancial AnalystExcel (advanced), SQLPython, Power BIProduct AnalystSQL, Python, Mixpanel/Amplitude, BI tooldbt, Jupyter NotebooksAnalytics EngineerSQL, dbt, Snowflake/BigQuery, PythonSpark, Git/CI-CD, AirflowData ScientistPython, SQL, scikit-learn, JupyterSpark, TensorFlow, MLflow
To understand how the data engineer vs data scientist career path differs from the analyst track — and which tool stack each demands — that comparison is worth reading before you commit to a specialization.
How to Build Your Data Analysis Tool Stack Without Wasting Time?

The most common mistake aspiring analysts make is trying to learn too many tools simultaneously. Here is the sequence that works — tested against what employers actually hire for.
Phase 1 — Foundation (Months 1–3): SQL and Python Basics
Start with SQL. Spend four to six weeks building genuine fluency with SELECT, JOIN, GROUP BY, aggregate functions, and window functions. Use a free public dataset on BigQuery or PostgreSQL to build a real portfolio project — something like analyzing public e-commerce order data or Indian flight delay records.
Add Python from month two. Focus exclusively on pandas, NumPy, and Matplotlib — not all of Python. A structured curriculum with guided projects gets you further than a self-taught year of scattered video tutorials.
Phase 2 — Communication Layer (Months 3–5): One BI Tool
Pick one BI tool based on where you want to work. If your target companies are on Microsoft infrastructure, learn Power BI. If they are Google Cloud shops or use Salesforce, learn Tableau or Looker Studio. Get one to genuine proficiency before touching the other.
Phase 3 — Modern Stack (Months 5–9): dbt and Cloud Warehouse
Once SQL and Python are solid, add dbt and a cloud warehouse (Snowflake or BigQuery). This is the transition from data analyst to analytics engineer — and where data analytics salary in India curves bend sharply upward. Analytics engineers with dbt proficiency in India command ₹12–22 LPA at mid-career, versus ₹6–10 LPA for Excel-and-SQL generalists.
Phase 4 — Specialization: Let Your Role Decide
By this point, your next tool should be driven by what your current role demands. E-commerce or fintech at scale → Spark and event-pipeline tools. Product analytics → Amplitude, Mixpanel, and experimentation frameworks. Move into data science → scikit-learn and ML pipelines.
If you are still evaluating whether is data science a good career move makes sense before committing to Phase 4, that read is worth your time.
If you want a structured path covering SQL, Python, BI tools, and the modern data stack — with practitioner-led instruction and an IIT Roorkee certificate — Futurense's Data Science and Analytics programs are designed around exactly this progression. Details at futurense.com.
What are the most important data analysis tools in 2026?
The most important data analysis tools in 2026 are SQL, Python (with pandas and NumPy), and at least one BI platform such as Power BI or Tableau. SQL handles data extraction from any structured database or warehouse. Python handles transformation, statistical analysis, and reproducible visualization. A BI tool communicates findings to non-technical stakeholders. Together, these three form the foundation of nearly every modern analyst workflow.
What is the best data analysis tool for beginners?
For absolute beginners, start with SQL using a free tool like PostgreSQL or Google BigQuery's free tier. SQL has a shallow initial learning curve and immediate real-world applicability — you can write useful queries within a week. Excel or Google Sheets is a useful parallel starting point for anyone in a business context where spreadsheets are already the shared working format. Both are free to start.
Is Python or R better for data analysis?
Python is better for most business data analysts in 2026. It has stronger job market demand, a larger community, and a natural extension path into machine learning without switching tools. R remains preferred in academic research, clinical statistics, and econometrics, where its statistical modeling depth and ggplot2 visualization library have decades of institutional use. If you are entering the industry job market, start with Python.
What is the best free tool for data analysis?
The best free data analysis tools in 2026 are PostgreSQL or BigQuery (SQL), Python with Jupyter Notebook or Google Colab (scripting), and Looker Studio (visualization). All three are used in real production environments — they are not beginner training wheels. Google Colab specifically provides free cloud-based Python notebooks with optional GPU access, eliminating the need for a powerful local machine.
Do data analysts need to know SQL?
Yes. SQL is the closest thing to a universal prerequisite in data analyst job descriptions. Nearly every analytics workflow begins with extracting data from a structured database or warehouse, and SQL is the standard interface for that task across PostgreSQL, MySQL, BigQuery, Snowflake, and Redshift. Analysts who know SQL can answer questions that no pre-built dashboard was ever designed to answer.
Power BI vs Tableau — which is better for getting hired in India?
Both are strong, and the answer depends on where you want to work. Power BI dominates in organizations on Microsoft infrastructure — BFSI, enterprise IT, and manufacturing are the strongest segments in India. Tableau is more prevalent in analytics-forward tech companies, MNC analytics centers, and product analytics roles. Check three to five job descriptions at your specific target companies before committing to either tool — they will tell you directly.


.avif)
.avif)