


With everything becoming digital, a significant amount of data is generated every second. Online activity, customer transactions, system logs, and app usage add to the volume of data collected by organizations. On its own, this data has limited value, but its importance lies in being organized, analyzed, and connected to real decisions.
To turn this raw data into something of value is why data science exists. Data science isn’t about collecting information or training models, but rather a clear process of converting that data into measurable outcomes. This process defines which data is essential, how it should be handled, and how it should be used.
The data science process provides a clear structure to the workflow. Without a process, efforts often lead to results that cannot be applied in real systems.
This guide walks you through each stage of the life cycle and explains how the steps depend on one another.
What Is the Data Science Process?
Data science is the process of extracting insights and knowledge from raw data, and the data science process provides a structured way to do this.
In practice, the process balances three dimensions:
- Business understanding: What decision the work is meant to support
- Data and technical execution: How data is collected, prepared, and analyzed
- Deployment and operational impact: Whether the output can be used inside real systems
A process is essential to avoid building models that cannot be deployed. It ensures results are usable in real workflows, not just reports.
The data science process is best understood through its life cycle.
Data Science Process Life Cycle: The Big Picture
The data science process is a loop, not a straight line. Many think of it as a sequence of work, but real data science rarely progresses in a single forward direction. Progress at one step often leads to changes in earlier stages.
Instead of working from start to finish, the process continuously loops as data, business needs, and user behavior change. The team often revisits earlier steps multiple times during a single project. This approach differs from a one-off analysis, where no revisions are made once the result is formed.
Common Frameworks Used to Describe the Data Science Process
Generic 5-Step Process
This beginner-friendly model covers problem definition, data collection, preparation, modeling, and evaluation. It is easy to understand but leaves out deployment and monitoring, giving the impression that work ends after evaluation.
CRISP-DM Framework
CRISP-DM (Cross-Industry Standard Process for Data Mining) reflects real-world projects where goals, data, and constraints change. It emphasizes business understanding and treats iteration as normal.
Rather than competing with modern machine learning, CRISP-DM provides a lens to understand why the steps exist and how they are connected. The difference in terminology is there, but the core structure remains the same for both.
CRISP-DM better explains deployment and iteration, which simpler models miss.
To see how these ideas are applied in practice, the following sections will guide you through the steps, one by one, from problem definition to deployment and monitoring.
Step 1: Problem Definition and Business Understanding
This is the most important step. A poorly defined problem leads to a poorly defined result.
Key activities:
- Translating vague goals into measurable objectives
- Defining success metrics tied to business
- Identifying data, time, and compliance constraints
At the first step, the focus is not on data or algorithms, but on clarity and simplicity. The goal is to translate vague intentions, such as “increase customer satisfaction,” into something that can guide data-driven work and informed decision-making.
Strong problem definition between stakeholders and the data team helps yield the desired results.
Step 2: Data Acquisition and Data Understanding
Now that the goal is clear, the next step involves collecting data from various sources. Data is collected from internal systems, logs, APIs, and third-party sources. It’s essential to collect enough quality data, even if it's not perfect.
Exploratory Data Analysis (EDA) is used to examine missing values, distributions, anomalies, and relationships. Findings from EDA lead to fine readjustments. Teams may realise the need for more data, or expectations around feasibility and accuracy may change. These adjustments are a normal result of this step and show that everything is working as intended.
Step 3: Data Preparation and Feature Engineering
This is the most time-consuming stage because real-world data is messy.
Work includes:
- Cleaning missing or incorrect values
- Removing duplicates
- Standardizing formats
Feature engineering turns raw fields into meaningful signals by:
- Encoding categories
- Creating time-based or aggregated features
- Applying domain knowledge
At this point, the process has to become repeatable, not just correct once. With changing data or the addition of new data, these same cleaning rules and feature logic must be applied consistently. These are the reasons teams invest in data pipelines, versioned datasets, and validation checks that ensure inputs behave as expected over time.
Step 4: Modeling and Experimentation
Modeling in data science is not a single training step but an iterative experimentation phase. The purpose is not to build the most complex model, but to understand what strategies best apply in the circumstances of the available data, constraints, and business needs.
Models are tested through controlled experiments using cross-validation and tracked versions. The data science teams that are strong are those that focus on learning speed rather than the sophistication of the model. Complex models are valuable only when they offer measurable gains and can be deployed, monitored, and maintained reliably.
Step 5: Evaluation and Validation
The model that is exceptionally well numerically can still not work in real-world constraints. This is why evaluation needs to be multi-dimensional, including behavior in failure, technical performance, and business usefulness. Evaluation is more than one metric.
It includes:
- Choosing business-aligned metrics
- Preventing data leakage
- Testing realistic data splits
- Performing error and bias analysis
In addition to metrics, qualitative evaluation is equally important. This includes error analysis to identify where and why the model failed, detecting patterns of systematic errors, and examining the fairness or bias not reflected in the aggregate scores.
Lastly, the model should also work from a business perspective. The stakeholders must look at the interpretability and usability of the outputs, the anticipated returns exceeding the expenses, and the readiness of the solution to integrate into the current systems.
Step 6: Deployment, Monitoring, and MLOps
After evaluating and validating a model, it should be deployed to be applied in actual conditions. The stage of deployment is when the work of data science is transferred to production systems, allowing for real-time or planned decision-making.
Based on the application purpose, the deployment may be in various forms:
- Real-time prediction APIs.
- Scheduled or periodic output batch jobs.
- Human-in-the-loop decision support dashboard.
Deployment is not the end process. Models are dynamic in nature, and the data distributions, user behavior, and external conditions are dynamic. Unobserved model performance may deteriorate silently over time.
Monitoring is concerned with tracking:
- Performance and the key metrics of prediction.
- Alterations in input data (data drift)
- Anomalies or unforeseen system performance.
Here, MLOps has a conceptual role. It brings in the practice of automation, version control, and controlled release to enable models to be updated, retrained, and deployed in a reliable manner.
Data Science Process Diagram
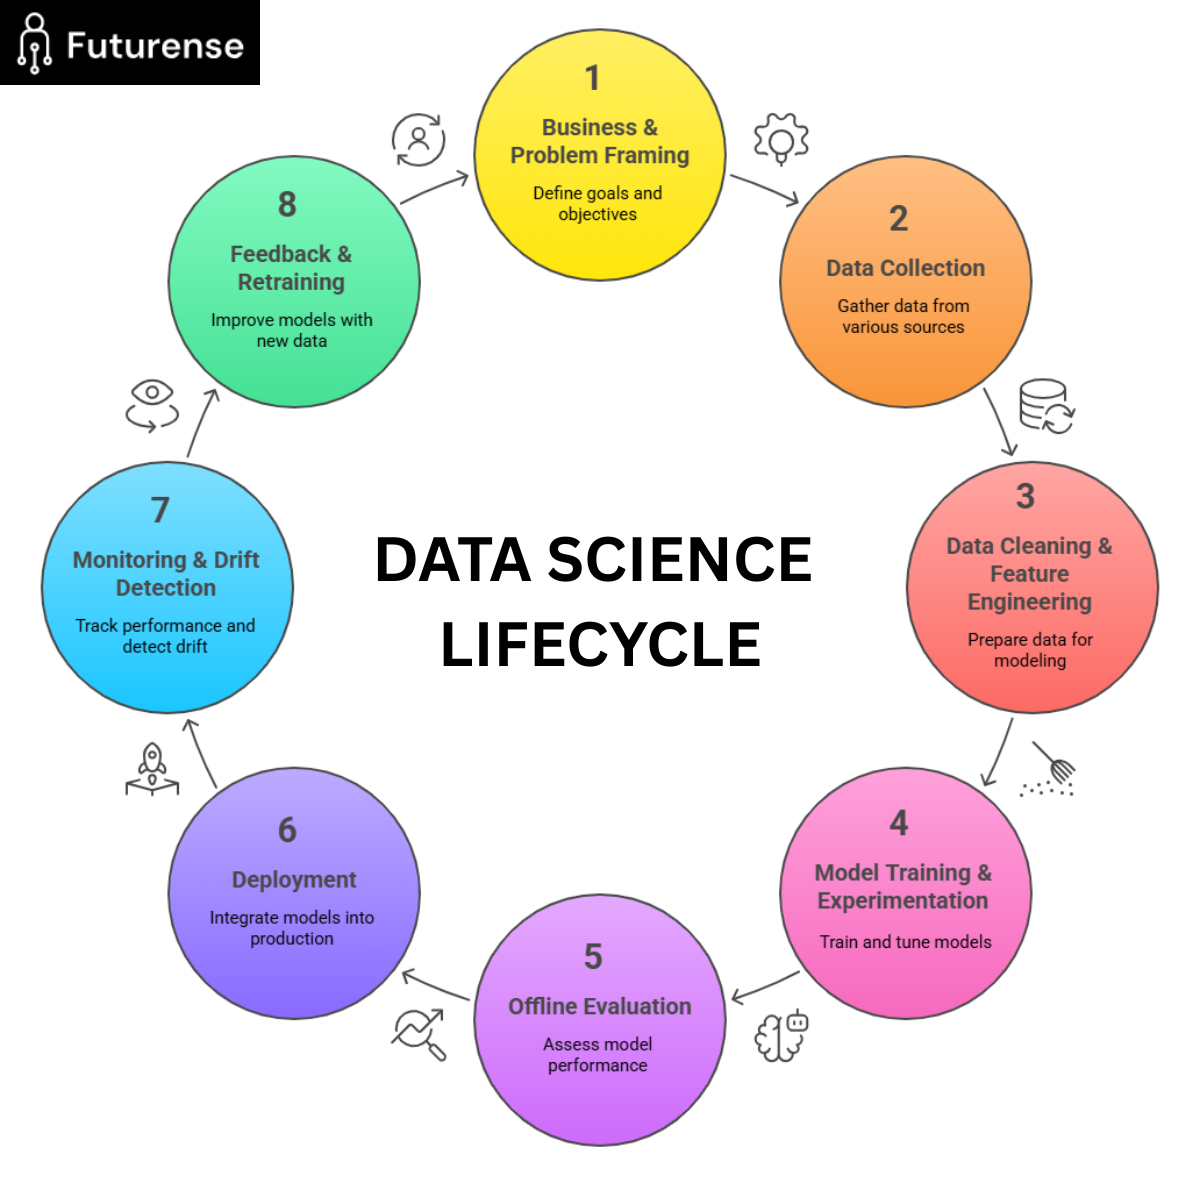
This diagram shows that data science is not a one-time, linear process. Each stage feeds back into the next, allowing teams to keep improving data, features, and models over time.
Building Industry-Ready Data Science Skills
To develop industry-ready data science capabilities, it is essential to move beyond learning individual tools, libraries, or algorithms. Real-world data science requires the ability to take a problem from definition through data preparation, modeling, deployment, and continuous monitoring.
In practice, most data science failures do not happen because of poor models. They occur because the problem was framed incorrectly, the data was weak, or there was no plan for how the results would be used in production. This is why employers value professionals who can manage the full life cycle instead of stopping at experimentation.
A structured Data Science Course helps learners build exactly this end-to-end capability by combining analytics, machine learning, and cloud-based deployment into a single, industry-aligned learning path.
FAQ: Data Science Process
What is the data science process?
The data science process is a structured workflow used to turn raw data into insights. It includes defining the problem, collecting and preparing data, building models, and deploying results to support real business decisions.
What are the 7 steps of the data science cycle?
The seven steps of the data science cycle are: 1. Problem definition 2. Data collection 3. Data understanding 4. Data preparation 5. Modeling 6. Evaluation 7. Deployment and monitoring These steps repeat as data and business needs change.
What are the 5 stages of data science?
The five main stages of data science are: 1. Business understanding 2. Data preparation Modeling Evaluation Deployment
Is data science an IT job?
Data science is not just an IT job. It combines technology, statistics, and business decision-making. While it uses programming and data tools, the main goal is to solve real-world problems using data, not just manage IT systems.


PG Diploma Program in GenAI-Powered Data Science & Engineering
IIT Gandhinagar
India's First Residential PG Diploma Programs from an IIT. Build Production-Ready AI systems. Live on campus for 6 months.

.avif)