

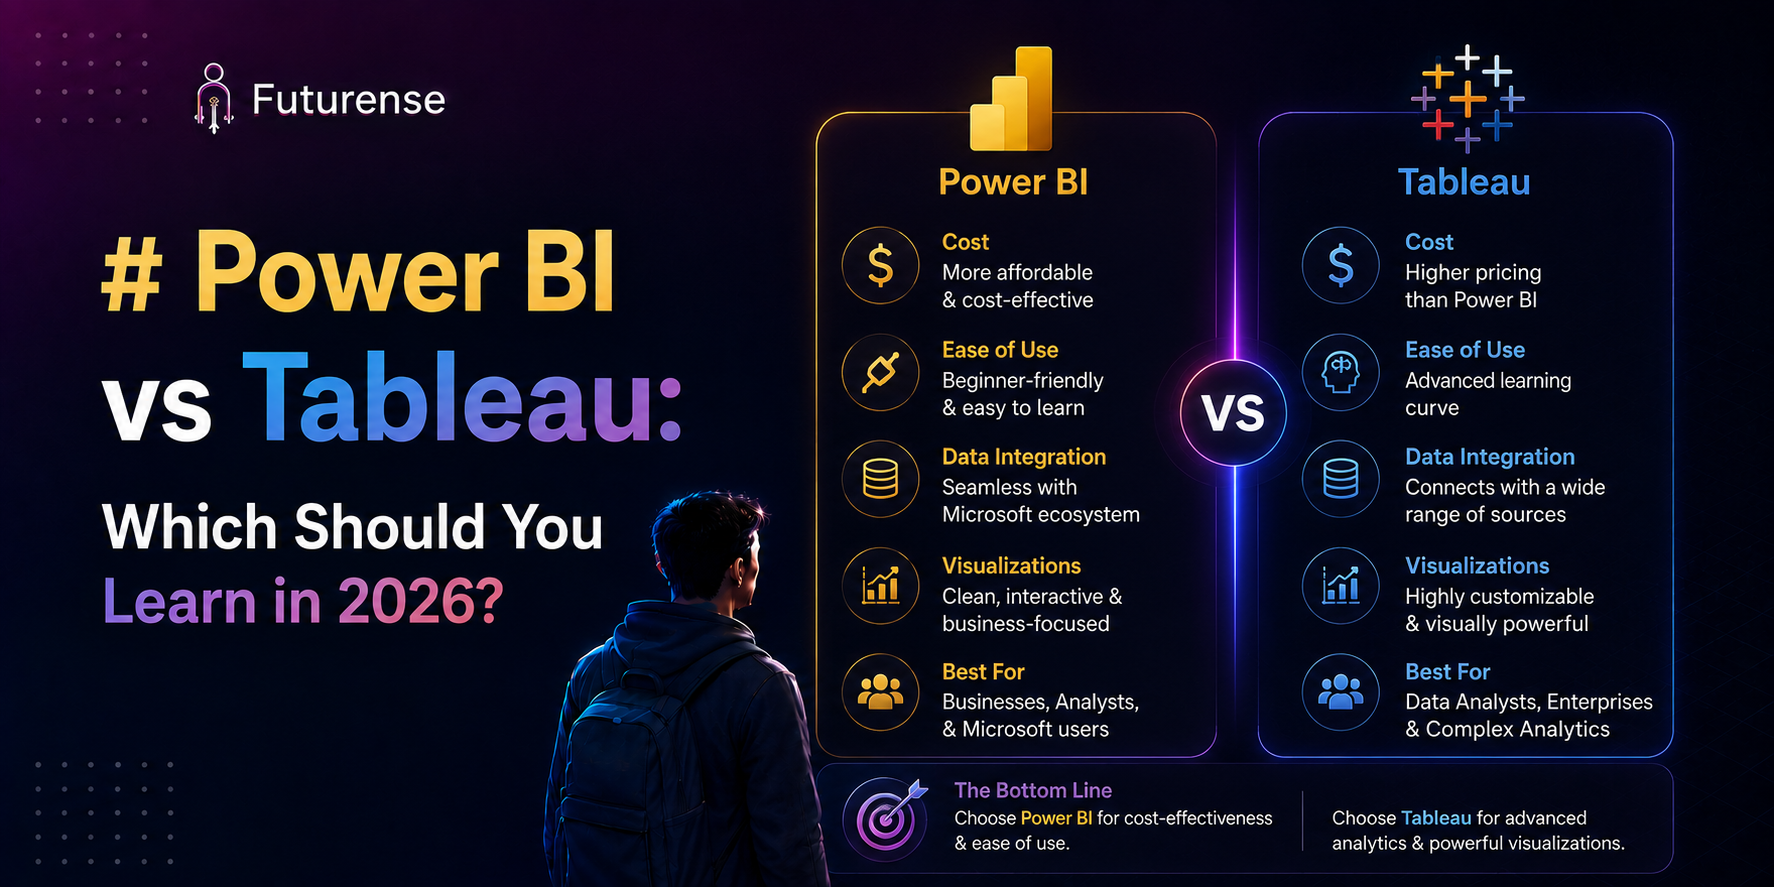


If you can only learn one business intelligence tool right now, learn Power BI first, it has significantly more job postings in India, costs a fraction of Tableau's licensing, and its Microsoft 365 integration makes it the default choice at most organizations already on Microsoft infrastructure. Tableau still wins on pure visual design quality and remains the stronger choice specifically for Salesforce-heavy organizations or roles emphasizing executive-facing dashboard polish. This guide breaks down exactly why, and when Tableau is genuinely the better call instead.
Which Should You Learn First: Power BI or Tableau?
For most people asking this question in 2026, Power BI is the more strategically sound tool to learn first. It's the most widely deployed BI tool globally by user count, it's deeply integrated with the Microsoft 365 ecosystem (Excel, Azure, SharePoint, Teams), which makes it the default choice at organizations already running on Microsoft infrastructure, and it's significantly cheaper to license than Tableau for those same organizations. If your goal is maximizing job applicability with the least amount of learning investment, this is the more defensible starting point.
That said, "which should you learn" isn't the same question as "which is better," and the honest answer depends on where you're trying to work. Tableau remains genuinely stronger in specific contexts, and dismissing it as the wrong choice for everyone would be an oversimplification this guide is deliberately trying to avoid.
Power BI vs Tableau: Head-to-Head
Where Each Tool Actually Wins
Power BI's core advantage isn't really a feature, it's ecosystem gravity. Once an organization is already using Excel, Azure, and Microsoft 365 broadly, Power BI becomes the path of least resistance: data connections, authentication, and workflow integration all work more smoothly than bolting on a separate BI platform. This is a big part of why it's become the most widely deployed BI tool globally by user count, not because it's dramatically more powerful on a feature-by-feature basis, but because it fits naturally into infrastructure most organizations already have.
Concretely, this means an analyst working inside an organization already standardized on Microsoft tools can go from an Excel spreadsheet to a live, shared Power BI dashboard without switching platforms, negotiating a separate license, or fighting with authentication across systems. For IT services firms and enterprises with large existing Microsoft footprints, which describes a substantial share of the Indian corporate landscape, that frictionless fit translates directly into hiring demand.
Tableau's core advantage is genuinely about output quality and self-service exploration. It's known for producing visually polished, interactive dashboards that let non-technical stakeholders explore data independently without needing to request a new report every time a question comes up. Organizations that already run Salesforce as their CRM also tend to gravitate toward Tableau specifically, since Salesforce owns Tableau and the integration between the two products is deliberately tight.
This design strength matters most in contexts where the audience for a dashboard is executives or external clients rather than other analysts. A consulting firm presenting findings to a client, or an internal team building dashboards leadership will actually open and explore themselves rather than skim once and forget, tends to lean toward Tableau precisely because the tool was built with that kind of polished, self-explanatory output as a first-class design goal, not an afterthought.
Job Market Demand in India
Power BI holds a clear edge in raw job posting volume across most of the Indian tech and analytics market, largely because so many Indian enterprises, IT services firms, and GCCs run on Microsoft-centric infrastructure already. Comfort with at least one visualization tool, Power BI or Tableau, is increasingly treated as a baseline expectation rather than a differentiator for data analyst and business analyst roles generally, which means the real competitive question isn't just "which tool" but how deep your skill goes beyond the basics.
Tableau demand concentrates more heavily in specific segments: consulting firms, larger enterprises with existing Salesforce deployments, and roles where dashboard design quality is explicitly part of the job description, executive reporting, customer-facing analytics, and similar. If you already know which industry or company type you're targeting, that context should weigh at least as heavily as raw job-posting volume when choosing where to invest your learning time.
Worth noting too: this landscape isn't static. As GCCs continue expanding rapidly across India, many bring their global parent company's existing tool standardization with them rather than choosing fresh, which means the specific tool a given GCC uses often has more to do with what its headquarters already standardized on abroad than with any independent evaluation of Power BI versus Tableau. Researching the specific tool stack of target employers, rather than assuming a market-wide default applies everywhere, is worth the extra step before committing to one platform exclusively.
Learning Curve: Which Is Actually Easier to Start With
Both tools are built around visual, drag-and-drop interfaces specifically to lower the barrier to entry compared to code-based analysis, which is a major reason data analyst roles built around BI tools remain more accessible to career switchers than data scientist roles requiring machine learning framework fluency. Neither tool requires the kind of statistical or programming background that a transition into data science typically demands.
Between the two specifically, most learners find Power BI's early learning curve slightly gentler if they already have Excel experience, since many of its core concepts (pivot-table-style thinking, formula logic through DAX) build directly on Excel intuition. Tableau's interface is arguably just as approachable for basic charting, but building genuinely polished, presentation-ready dashboards tends to take longer to master well, precisely because the tool's strength is in that higher ceiling of visual sophistication.
This difference shows up clearly once learners move past basic charts into anything resembling a real, portfolio-worthy project. Power BI's DAX formula language has its own real learning curve once you move beyond simple aggregations, calculated columns, measures, and time-intelligence functions all take deliberate practice to use correctly, so "easier to start" shouldn't be mistaken for "nothing left to learn." Tableau's calculated fields serve a similar purpose with a different syntax, and neither tool's advanced functionality is something you'll fully absorb from a single beginner course, regardless of which one you pick first.
Can You Learn Both? Should You?
For a genuinely serious data analytics career, learning both eventually is a reasonable goal, and many working analysts do end up comfortable in both tools over time, since different employers standardize on different platforms. But for someone just starting out, splitting attention evenly between both from day one usually slows down reaching real proficiency in either.
The more effective approach: pick one based on your actual target job market (Power BI for broader applicability and Microsoft-centric organizations, Tableau if you're specifically targeting Salesforce-heavy or design-focused roles), get genuinely proficient, then pick up the second tool once you're already employed and have a specific, concrete reason to learn it, a new employer's stack, a client requirement, or a role that explicitly calls for it.
TL;DR
- Learn Power BI first if you're optimizing for job availability, cost, and general applicability, it's the most widely deployed BI tool globally by user count
- Learn Tableau if you're targeting Salesforce-heavy organizations, executive dashboard design roles, or already work somewhere with an existing Tableau license
- Power BI is significantly more affordable for organizations already on Microsoft infrastructure
- Both are drag-and-drop tools with a genuinely lower barrier to entry than machine learning frameworks, making either a strong entry point for career switchers into data analytics
- See our Top Data Analysis Tools guide for how both fit into the broader analyst toolkit alongside SQL, Python, and dbt
Should I learn Power BI or Tableau first in 2026?
For most people, Power BI, given its broader job market demand in India, lower cost for Microsoft-infrastructure organizations, and status as the most widely deployed BI tool globally. Learn Tableau first specifically if you're targeting Salesforce-heavy organizations or dashboard design-focused roles.
Is Tableau harder to learn than Power BI?
Not dramatically. Both use drag-and-drop interfaces with a lower barrier to entry than coding-based tools. Power BI's early curve is often slightly gentler for those with Excel experience, while Tableau's higher ceiling for polished visual design takes longer to fully master.
Which pays more, Power BI or Tableau skills?
Compensation is driven more by the role and seniority than by which specific BI tool you know. Both are increasingly treated as baseline expectations for data analyst and business analyst roles rather than standalone salary differentiators.
Do I need to know both Power BI and Tableau to get a job?
No. Most roles require proficiency in one, matching whichever tool that specific employer has standardized on. Learning both eventually is valuable for career flexibility, but isn't necessary to start.
Is Power BI or Tableau better for someone switching careers into data analytics?
Both are strong entry points precisely because their visual, drag-and-drop interfaces don't require a programming or statistics background, unlike a transition into data science. Power BI's broader job market and Excel-adjacent learning curve often make it the more practical first choice for career switchers specifically.
Which tool has more job openings in India?
Power BI generally shows higher job posting volume across the broader Indian market, reflecting how many Indian enterprises and IT services firms run on Microsoft-centric infrastructure already. Tableau demand concentrates more in consulting, larger enterprises, and Salesforce-integrated organizations.


MBA with AI for Working Professionals
IIM Sirmaur
India’s first AI-native MBA, designed for tech & non-tech professionals.

.avif)