


Why LLM and Agentic AI Applications Need Different Monitoring
Traditional application monitoring answers a narrow question: is the system up, and is it fast? That's necessary but nowhere near sufficient for an LLM-based application, because an LLM app can be fast, available, and completely wrong at the same time. A model can return a confident, well-formatted, low-latency answer that's factually fabricated a failure mode traditional uptime and latency dashboards are structurally unable to catch.
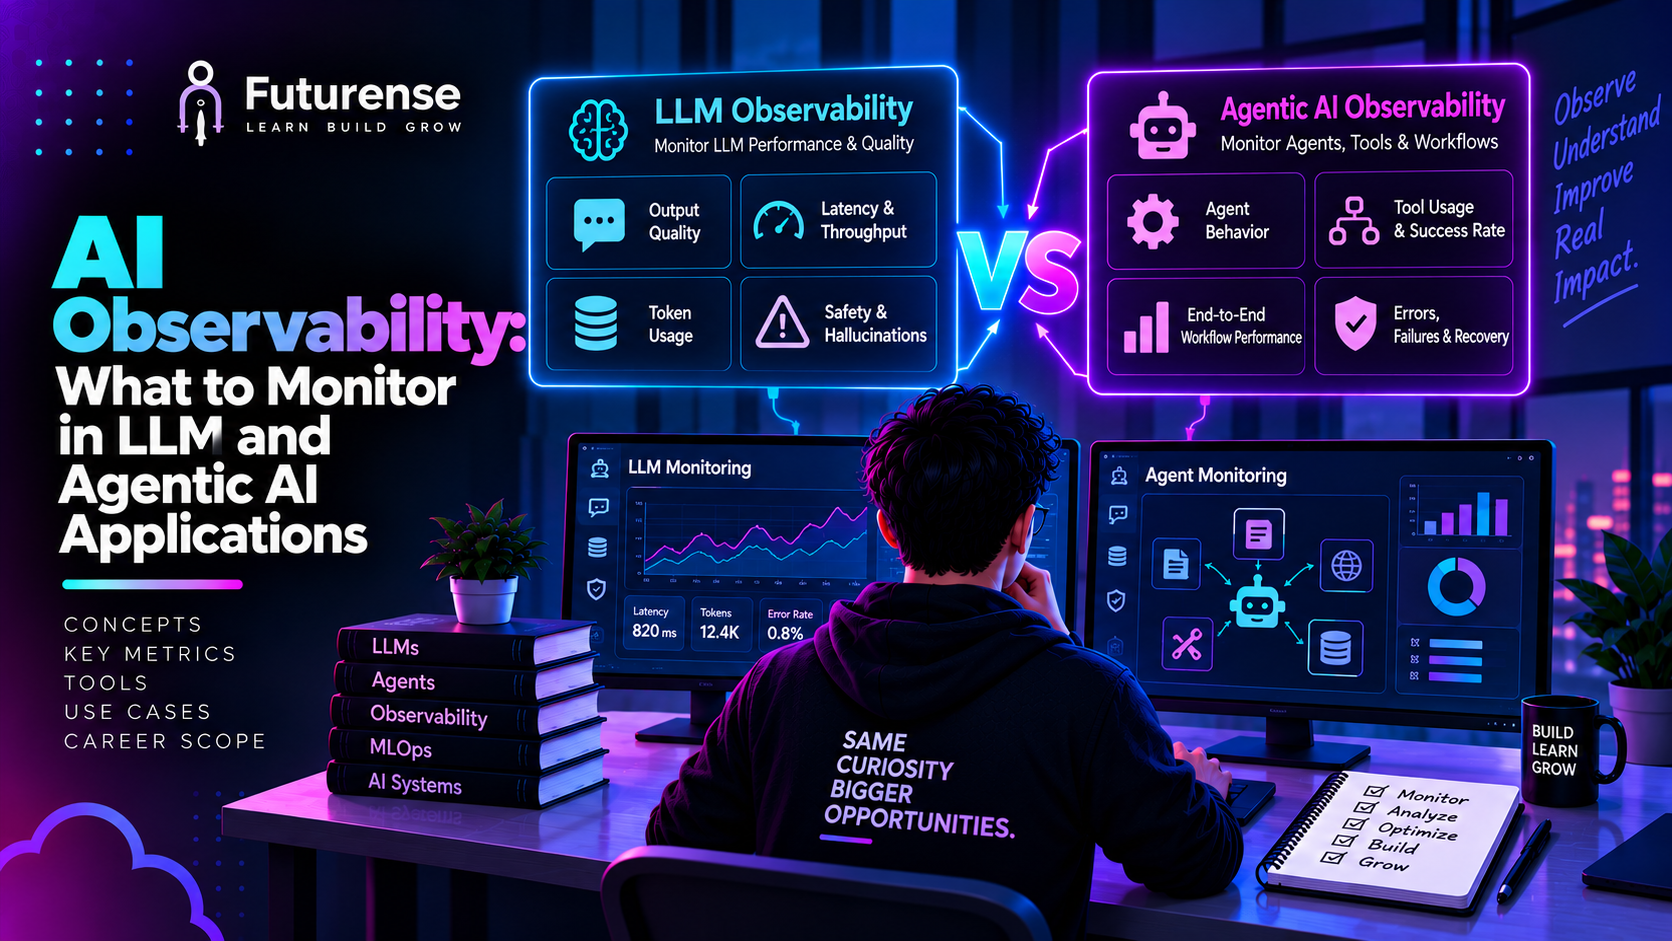
Agentic systems compound the problem. An AI agent doesn't produce one output from one input it runs a multi-step loop of planning, tool calls, and decisions, any one of which can go wrong without triggering an error, a timeout, or a crash. The system stays "up" the entire time it's quietly doing the wrong thing. This is the core reason AI observability exists as a distinct discipline rather than a rebrand of standard application performance monitoring (APM): it has to make probabilistic, multi-step, often-silent failure modes visible. For a conceptual introduction to the discipline itself, see our companion guide, What Is AI Observability? A Complete Guide for Beginners this article picks up where that one leaves off, with the specific metrics to actually track.
Layer 1: Infrastructure and Cost Metrics
These are the closest thing to traditional APM, but with AI-specific additions that standard dashboards don't surface by default:
- Latency, broken down by stage total response time isn't enough; you need retrieval latency, model inference latency, and tool-call latency tracked separately, because a slow agent is usually slow in one specific stage, not uniformly
- Cost per request/session token-based pricing means cost scales with usage patterns in ways traditional infrastructure cost doesn't; a single verbose conversation or an agent stuck in a retry loop can spike spend without any infrastructure alert firing
- Token usage input and output tokens per call, tracked over time, both to control cost and because unexpectedly high token counts are often an early signal of a context-assembly problem or a runaway agent loop
- Uptime and error rates API failures, rate-limit errors, and timeouts from the underlying model provider, which need their own alerting separate from your application's own uptime
Layer 2: Model-Level Quality Signals
This is the layer traditional monitoring has no equivalent for, because it's about whether the output is actually correct, not whether the system responded:
- Hallucination rate the frequency with which the model generates confident but factually incorrect or unsupported content; usually measured via automated evaluation against source documents or ground-truth data, since manual review doesn't scale
- Groundedness score for RAG pipeline-backed applications specifically, how well the generated answer is actually supported by the retrieved documents, as distinct from being merely plausible-sounding
- Retrieval relevance whether the documents a RAG system retrieves are actually relevant to the query; poor retrieval quality is one of the most common root causes of downstream hallucination, and it's invisible unless you're specifically scoring retrieval separately from generation
- Model and data drift whether the distribution of inputs or the model's behavior is shifting over time relative to its evaluation baseline, which can silently degrade quality even when nothing was explicitly changed
- Output quality/toxicity scoring automated checks for tone, safety, bias, and policy compliance, particularly important for customer-facing applications
Layer 3: Interaction-Level Tracing
Once quality signals flag a problem, you need the ability to actually see what happened this is where "observability" earns its name over plain "monitoring":
- Full trace and span capture the complete record of a request's path through the system: the prompt sent, the context assembled, any retrieved documents, the model's raw response, and any post-processing applied, all linked as a single traceable unit
- Prompt and response logging not just for debugging individual failures, but as a dataset for detecting patterns across many failures that no single trace would reveal
- Session-level context for multi-turn applications, tracking how context and conversation state evolve across a session, since a failure at turn 5 is often caused by something that happened at turn 2
Layer 4: Agent-Specific Monitoring
Everything above applies to a single-call LLM application. Agentic AI systems need an additional layer of monitoring aimed at the multi-step loop itself, not just individual model calls within it:
- Tool call success rate the percentage of tool/function calls that execute successfully versus fail, time out, or return unexpected results; a rising failure rate here is often the earliest signal of an integration or environment problem
- Task completion rate whether the agent actually achieves the end goal it was given, as distinct from whether individual steps within the task succeeded; an agent can complete every tool call successfully and still fail the actual task
- Step count and loop detection tracking how many steps an agent takes per task, with alerting on abnormal step counts that suggest the agent is stuck repeating an action without making progress
- Decision/planning trace visibility into the agent's intermediate reasoning and planning steps, not just its final output, since debugging why an agent chose a wrong action requires seeing the plan it was working from
- Escalation and fallback rate how often the agent hands off to a human or falls back to a simpler mode, which is a useful proxy for how often it's operating outside its reliable capability range
For teams building on AI agent architecture with multiple cooperating agents, this layer gets more complex still you need per-agent metrics as well as system-level metrics for how well agents are coordinating, since a failure can originate in the handoff between agents rather than inside any single agent's own logic.
Building an Observability Stack: Where This Fits in LLMOps
Observability isn't a bolt-on dashboard it's one of the core operational responsibilities inside the broader discipline of LLMOps vs MLOps, sitting alongside deployment, evaluation, and continuous improvement. In practice, most teams build their observability stack in stages:
- Start with infrastructure and cost metrics the lowest-effort layer, and often already partially covered by existing APM tools
- Add prompt/response tracing the foundation everything else depends on; you can't score quality on interactions you didn't capture
- Layer in automated quality evaluation hallucination and groundedness scoring, usually via a dedicated LLM-eval framework rather than manual review
- Add agent-specific tracking last only relevant once you're running genuinely multi-step, tool-using systems rather than single-call LLM features
Several dedicated platforms exist specifically for this stack (rather than general APM tools retrofitted for AI), and comparing MLOps tools is a reasonable starting point for teams deciding what to adopt versus build in-house.
Common Monitoring Gaps Teams Miss
- Treating uptime as a proxy for correctness the single most common mistake; an LLM app can be 100% available and still be silently wrong most of the time
- Only monitoring the final output, not the full trace makes root-cause debugging nearly impossible once a quality issue is flagged
- No agent-specific metrics on top of model-level metrics teams that monitor the underlying LLM calls but not the agent's task-level success rate miss the failure mode that actually matters to users
- No baseline for drift detection without a stored evaluation baseline, "drift" has nothing to be measured against
- Cost monitoring disconnected from behavior monitoring a cost spike is often a symptom of a behavioral problem (a loop, a retry storm, excessive context) rather than a pricing issue on its own, but teams that only watch a billing dashboard miss that connection
TL;DR: Monitoring a production LLM or agentic AI application means tracking four layers at once: infrastructure health (latency, cost, uptime), model-level quality (hallucination rate, groundedness, drift), interaction-level behavior (token usage, prompt/response pairs, retrieval relevance), and for agents specifically task-level outcomes (tool call success rate, step count, loop detection, task completion rate). Traditional APM tools cover the first layer; they miss the other three entirely, which is why teams running LLM and agentic systems in production need a dedicated observability stack built for probabilistic, multi-step behavior.
What's the difference between AI observability and traditional application monitoring?
Traditional monitoring tracks whether a system is up and fast. AI observability adds model-level quality signals (hallucination rate, groundedness, drift) and, for agents, task-level outcome tracking because an LLM or agentic system can be fully "up" while producing wrong or incomplete results.
What are the most important metrics to monitor for a production LLM application?
At minimum: latency and cost per request, token usage, hallucination/groundedness rate, and full prompt-response tracing. RAG-backed applications should also track retrieval relevance specifically, since poor retrieval is a common root cause of hallucination.
What should you monitor differently for AI agents versus single-call LLM applications?
Agents need task-level metrics on top of model-level ones: tool call success rate, task completion rate, step count with loop detection, and visibility into the agent's intermediate planning steps not just its final output.
How do you detect hallucinations in a production LLM application?
Typically through automated evaluation that scores generated outputs against source documents or ground-truth data, since manual review doesn't scale. For RAG systems, a groundedness score specifically checks whether the answer is actually supported by the retrieved context.
Is AI observability part of LLMOps?
Yes. Observability is one of the core operational functions inside LLMOps, alongside deployment, evaluation, and continuous improvement it's the visibility layer that tells you whether the rest of the LLMOps pipeline is actually working.
Do I need agent-specific observability tools, or will standard APM tools work?
Standard APM tools cover infrastructure metrics (uptime, latency, cost) but have no visibility into model output quality or agent task-level behavior. Most teams running LLM or agentic systems in production adopt a dedicated LLM/agent observability layer alongside, not instead of, their existing APM stack.


Advanced PG Certificate in AI Engineering on Cloud and AIOps
IIT Roorkee
Engineer AI Systems for Top Enterprises, with the Most Critical Skills of the Decade.